HOW TO MAKE A CURVED LINE GRAPH IN EXCEL & GOOGLE SHEETS
If you often work on MS Excel, then it is very simple to add the graph in the spreadsheet. Adding the graphs or charts makes your data more interactive, productive and attractive and creating and adding the graphs is very easy. However, there are straightforward steps for creating and adding the graphs and charts in the spreadsheet while using the Google Sheets or Microsoft Excel but still, the problem lies with the sharp edges in the graph that appears by default. Even though the graphs define the up curves and downs of the data exactly, still some people don’t prefer it.
If you also don’t prefer such graphs then you can take steps to not only for smoothing the edges but also adding a new graph which will be curved too by going through the below guidelines:-
For making a smooth curved line graph
First of all, the users will need to enter their data to appear in the spreadsheet and then move ahead to select the data to make a graph.
- The users will be required to move to the section Charts while going to the Insert tab and then tap on the Chart Area or Insert line tab.
- The users will need to enter a line graph of 2-D that they wish to be displayed in their spreadsheet.
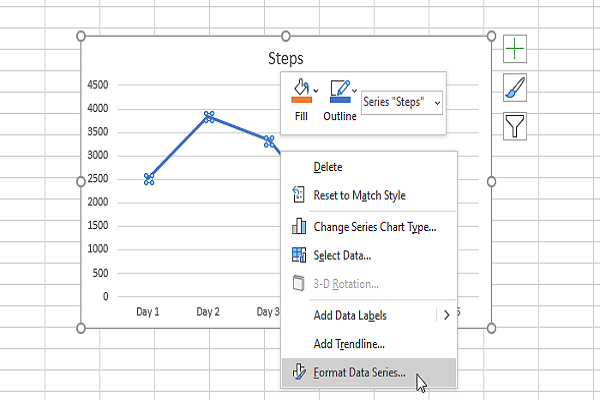
- When you complete the inserting of the chart or graph, then click right on the line which is blue that appeared to you.
- Now, go to the option Format Data Series and click on it.
- The users will further find a panel on their right side and from there move straight towards the section having the option Fill & Line.
- Then, the users will need to click on the checkbox with the option of the Smooth line.
For making the Curved Line Graph in the Google Sheets
- The users will need to create the spreadsheet by entering proper data and then select it.
- Now, the users will need to tap on the Insert option and move to choose the Chart appearing in the available options.
- The users could get the chart as they need according to their data by default and you will need to change the data into a line graph.
- For converting into a line graph, you will need to make a click on the options chart and then expand the appeared menu displaying the types of charts.
- Further, you have to choose something from the label Line and click on it.
- Now, the users will be required to move to the tab Customize and then expand the menu having the Chart style.
- In the end, the users can make a click on the option of checkbox Smooth.
The users could find that after following the above guidelines carefully they will become able to change the sharp edges as per their preferences. The steps are quite straightforward and anyone could follow them conveniently. The benefits of using charts and graphs in the spreadsheet are well known to the people and they always intend to modify in the graphs so that their graphs could become more professional. Such practices not only improve your productivity but also helps you to organize your business data in a better way and more smoothly.
Smith is an inventive person who has been doing intensive research in particular topics and writing blogs and articles on webroot.com/safe and many other related topics. He is a very knowledgeable person with lots of experience.
Source:- https://webroot.uk.com/blog/how-to-make-a-curved-line-graph-in-excel-google-sheets/


Post Your Ad Here
Comments