Stock Analytics Platform Development: Building Systems for Understanding, Not Execution
If you look at how serious teams actually work with markets, you quickly notice that trading terminals are not where most thinking happens. The real work takes place inside dedicated analytical environments, closer to a professional social and analytics layer for market research than to a classic order-entry screen.
A trading terminal is opened when a decision has already been made. An analytics platform is opened when decisions are still uncertain — and again after they are finished, when someone needs to understand what actually happened.
That distinction is subtle, but it defines everything that follows.
Analytics platforms are not optimized for speed of execution. They are optimized for continuity of reasoning. They exist to collect history, normalize it, compare it, and make it uncomfortable to rely on short memory. Over time, they become institutional memory: where assumptions are checked, patterns are discovered, and mistakes stop being anecdotal.
This is why companies eventually outgrow generic tools. The more central analysis becomes to the business, the more damaging it is to depend on black-box calculations and fixed workflows.
What Stock Analytics Platforms Are Really Used For
Most analytics platforms are not built for occasional deep research. They are built for daily work.
They support four recurring activities.
First is behavioral familiarity. Teams study how assets usually move: volatility regimes, reaction to events, long-term structure. The goal is not prediction. It is recognition.
Second is comparative research. Assets, sectors, and time periods are constantly evaluated against each other. The platform becomes a lens for seeing relationships instead of isolated charts.
Third is portfolio-level thinking. Once trades accumulate, single-position views become misleading. Exposure, overlap, correlation, and drift only appear when everything is seen together.
Fourth is post-trade review. This is where analytics quietly pays for itself. Assumptions are tested against outcomes. Strategies are separated from randomness. Performance stops being a feeling and becomes a dataset.
These workflows overlap continuously. The platform matters because it supports all of them without forcing users to shuttle data between incompatible tools.
Why Companies Build Custom Analytics Systems
Off-the-shelf platforms work well until analytics becomes part of the product itself.
That moment usually arrives quietly. Teams start exporting more. Internal metrics creep in. Workflows no longer match default dashboards. Calculations become harder to verify. At some point, adapting the business to the tool costs more than adapting a tool to the business.
Custom platforms are built for three main reasons.
Differentiation. When everyone has the same indicators, advantage shifts to how data is processed. Proprietary scoring models, domain-specific analytics, and tailored dashboards reshape how decisions are made.
Control over data. Raw feeds, normalization rules, and calculation pipelines become visible instead of assumed. Errors are caught earlier. Confidence improves.
Monetization. Once analytics is a product surface, access can be layered: deeper history, advanced metrics, collaborative workspaces, internal indicators. These only work when the platform owns its logic end-to-end.
This is also where many platforms evolve beyond individual analysis. They add structured sharing, collaborative review, and performance visibility. A good reference point is how TraderTale’s analytics-driven trading platform treats portfolios not as isolated records, but as evolving analytical objects.
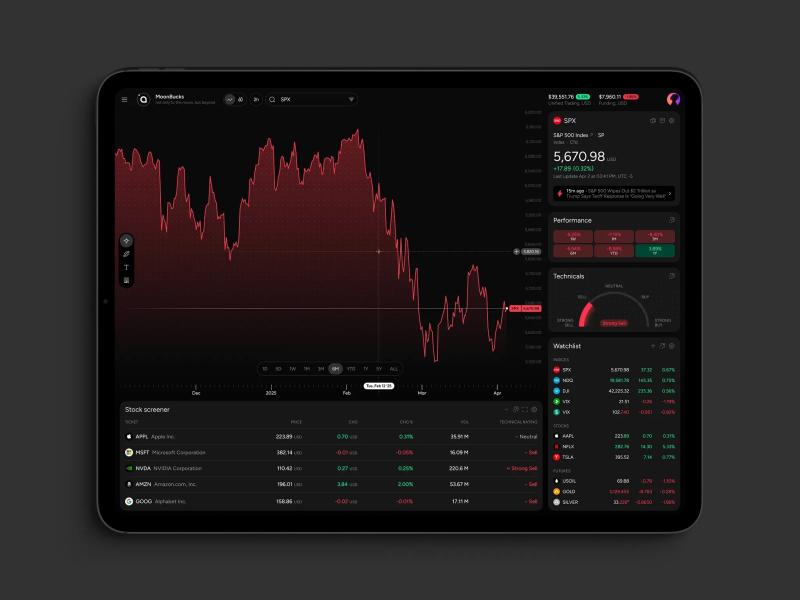
The Core of a Modern Analytics Platform
There is nothing exotic about the required feature set. What separates usable systems from frustrating ones is stability, coherence, and data integrity.
Most platforms converge on the same foundation:
High-performance charting that tolerates long histories, overlays, and frequent context changes without degrading.
Multi-timeframe continuity so perspective shifts don’t reset analysis.
Reliable data ingestion from multiple providers, with explicit normalization and validation.
Portfolio and risk layers that surface exposure, drawdowns, concentration, and volatility instead of just totals.
Alerts and automation that point attention without pretending to replace judgment.
None of these are novel. But each becomes difficult when combined. Most engineering effort is spent not adding features, but keeping these views consistent while data keeps arriving.
How These Platforms Are Usually Built
Analytics platforms rarely fail because of missing features. They fail because foundational decisions are made too late.
Teams that succeed tend to start with constraints:
Who is this for?
What actions repeat daily?
Which numbers must never disagree?
What latency is actually required?
Architecture follows from this. Data ingestion is separated from processing. Processing is separated from delivery. Not everything is real time. Not everything is cached. Boundaries are drawn early.
UI design is treated as cognitive tooling, not presentation. Clarity, density, and predictability matter more than aesthetics.
Development emphasizes correctness first, performance second, extensibility third. Most rewrites happen when these priorities are reversed.
The Problems That Decide Success
Three pressures dominate analytics platforms in production.
Data behavior. Feeds burst, lag, duplicate, and disappear. Systems must absorb this without visual instability.
Performance under load. Many charts, many users, many filters. Weak aggregation paths surface quickly.
Trust. Discrepancies between views erode confidence faster than any outage.
Solving these is not about frameworks. It is about instrumentation, testing with real volumes, and building observability into the product from the start.
Closing Thought
A stock analytics platform is not a dashboard. It is a reasoning environment.
The platforms that endure are the ones that quietly make teams harder to fool — by recent memory, by isolated wins, by visual noise.
They do this by forcing continuity, surfacing structure, and keeping interpretation grounded in consistent data.
And when analytics becomes a core business capability rather than a supporting tool, it naturally moves into the territory of specialized fintech platforms and financial software ecosystems, where engineering decisions shape not just products, but how organizations think.
That is the real work.

Post Your Ad Here
Comments