 Articles
Everything you need to know about Gartley and Other Trading Patterns
by Dorano V. Professional PR since 2010As time goes on, our understanding of markets continues to improve. With each passing year, traders have access to another year’s worth of data and, as a result, identifying common trading patterns becomes significantly easier.
With any given speculative asset, there will be forces of support causing prices to increase and forces of resistance causing prices to decrease. While these forces and instances of change may appear to be “random” to people who are unfamiliar with trading, they actually frequently assume a predictable, geometric form.
Because there will still be an unpredictable human element to every market, geometric and harmonic trading strategies cannot possibly guarantee that a given position will be profitable. However, by using the historical record and Fibonacci sequencing, you can enter into positions with a greater degree of confidence.
One of the most consistent and useful trading patterns you will find is known as the “Gartley.” Along with its related derivatives, this pattern focuses on the relationship between the five most recent price swings. When these five points create a quadrilateral with the correct ratios, a profitable trading opportunity may have emerged. In this article, we will discuss the most important things for you to know about Gartley trading patterns and how you can use common patterns to become a successful trader.
Introduction to Trading Patterns and Harmonic Trading
When analyzing price charts, there is one question that ought to remain on every day trader’s mind. Where are prices currently moving? Are prices more likely to increase, decrease, or remain relatively the same?
In order to answer this question, traders will pay close attention to any signs of continuations or reversals. Signs of (price positive) continuity will cause traders with long positions to hold, while signs of trend reversals may indicate possible exit points. In order to have a better understanding of which price movement is about to occur, it will be helpful to familiarize yourself with the mechanics of the market as a whole.
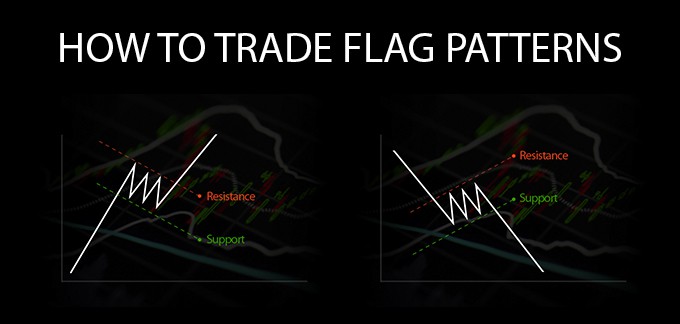
Shaped by the forces of resistance and support, traditional chart patterns include wedge patterns, pennants, flags, triangles, head and shoulders, double tops/bottoms, and various others. In fact, some traders are so committed to the principles of harmonic and geometric trading, they will barely even pay attention to the underlying price.
When markets behave in “unusual” ways, they will inevitably be returned to the mean—if it was not for this fact, geometric trading would not be reliable. But with decades (even centuries) of market data available for traders to analyze, geometric trading has proven itself to be remarkably consistent.
Understanding the Gartley and Related Trading Patterns
After observing some common trends within the market, trading theorists H.M. Gartley published a book called “Profits in the Stock Market.” In this book, Gartley helps defend the use of harmonic trading patterns and also begins to explain how these patterns can be identified and exploited.
Gartley developed his theory using a very natural phenomenon known as Fibonacci sequencing. Fibonacci sequences can be found all throughout nature, ranging from the shape of flowers to the impact of earthquakes to everything in between. Markets, as it turns out, are no exception.
The Gartley Pattern is a reversal pattern, indicating that price will begin moving in a different direction. Looking at the last five turning points (also known as waves or impulses), harmonic traders will assign each of these points a specific letter. Moving from left to right, these points will be assigned, X, A, B, C, and D.
Within the Gartley shape—which takes the form of a quadrilateral—the XA line will indicate the initial trend, the AB line indicates the first pullback, the BC line indicates a return to the trend, and the CD line indicates the final price movement. The ratios between each of these lines will be very important; if the ratios do not match Fibonacci values, then harmonic trading will not be possible.
The Fibonacci retracement levels for the Gartley pattern include 61.8 percent found at point B and (targeted) 78.6 percent at point D. But even if the conditions for the Gartley cannot be found, there may be other variations of this pattern as well. Using the same basic structure and underlying principles, “spin-offs” of the Gartley pattern include the bat pattern, the butterfly pattern, the crab pattern, and various others. In order to hedge risks and increase profit opportunities, many trading strategies will involve the active use of multiple harmonic patterns.
Harmonic Trading Patterns in Action
If the concept of harmonic trading initially seems confusing, you are certainly not alone. In order to make sure you are familiar with market mechanics and Fibonacci sequencing in general, it will be a good idea to practice trading on paper before risking any actual capital.
The first rule of using the Gartley pattern, or any harmonic pattern for that matter, is to make sure that the Fibonacci ratios actually exist. If these ratios cannot be found on a price chart, you will simply need to use a different trading strategy. The Gartley ratios include: 61.8 percent at XB, 78.6 percent at XD, 127 and 161.8 percent at BD, and 38.2 and 88.6 percent at AC.
When market conditions are bearish, the Gartley will assume a shape where X remains above B and D, and C remains above A. Though bearish markets are a bit riskier than bullish markets, you can expect to profit by entering into the market at points A and C, and exiting the market at point D.
During bullish conditions, as you might expect, your strategy will need to be reversed. Entering the market at points X, B, and D will all be profitable. Following point D, profits may continue to accumulate. However, some additional analysis will likely be necessary.
Using the Gartley and Other Trading Patterns to Improve ROI
Now that you are familiar with the Gartley trading pattern, you will be able to exploit the market in ways that were previously out of reach. However, as suggested, there will still be some risks involved. In order to maintain a strong ROI, consider the following risk prevention techniques:
· Wait until a perfect or near perfect Gartley comes to form—don’t force positions that are not currently supported
· Use additional trading patterns, such as the bat, butterfly, and crab to help expand your available options
· Issue stop losses to control your level of exposure
· Apply these strategies to large, continuous markets with liquid assets (such as the forex market)
· Keep practicing on paper until you understand what you are doing
As long as you can be patient and adhere to proven risk-prevention mechanisms, harmonic pattern trading is something you can easily do.
Conclusion
In 1935, H.M. Gartley rocked the trading world with the discovery of several new trading patterns that are still in use today. By understanding how to identify and properly trade the Gartley pattern, you can improve your ROI without the need to assume any additional risks.
Sponsor Ads

Created on Jul 2nd 2019 17:13. Viewed 178 times.


