 Articles
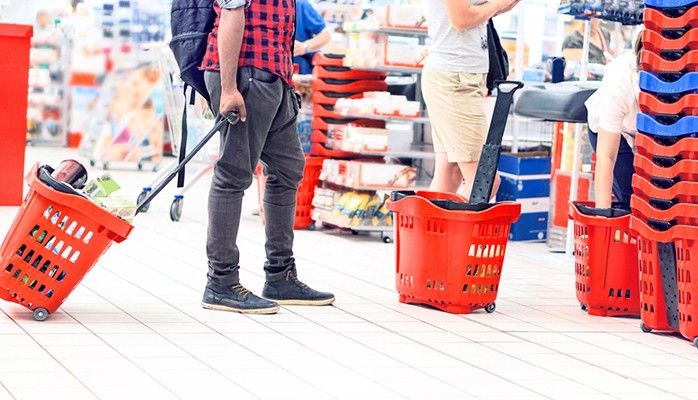
Using Technology to Analyze Foot Traffic in Retail Stores
by Martin Hildgen Web AnalystIn the physical world, every activity of the customer produces data in the same way, however only a handful of locations are measured and optimised based on these valuable data.
Despite how much online shopping has transformed the retail industry, people still love to visit brick-and-mortar stores. When e-commerce stores initially came to the fore, many predicted the demise of in-person shopping. So far, they have all been wrong.
People will always visit the mall with friends and loved ones. When they want to stock their kitchens, their first instinct is to visit a nearby grocery store not open a browser tab. People will always want to feel the products with their hands and interact with sales associates. This is why there will always be foot traffic at retail stores. We may be in the digital age, but the allure of physical shopping is as strong as ever.
So, how can retail store owners/managers maximize this constant foot traffic? Yes, people will always visit physical stores, but how can you ensure that they visit YOUR store? And when they visit your store, how can you make the most of their visits? How do you turn visitors into buyers and buyers into regular customers? The answer is simple: you take advantage of the digital age; you leverage technology.
Why Retailers Need to Analyze Foot Traffic?
For long-term profitability, retail stores need to attract visitors constantly, gain new customers, and keep existing customers satisfied. Store operations need to evolve constantly and with customers’ needs.
By analyzing how your current visitors behave, you gain an insight into what they want, what drives their buying decisions, and how to keep them coming back. Armed with this information, you are better placed to convert more visitors to regular buyers. Of course, what works for one customer may not work for all the others, but that’s not a problem.
Technology makes it possible to analyze the behavior of thousands of customers and come up with prevalent trends. These trends ensure that you satisfy most of your customers. Furthermore, the technological tools described in this article are self-evolving; so every new data-backed strategy is an upgrade on the old one.
The Diverse Uses of People Counting Technology
People counting technology leverages door counters to provide an accurate measure of foot traffic in a store. Simply put, it tells you how many people are in your store at any particular time. On its own, this information can be used to measure store performance, identify a store’s peak/off-peak periods, and benchmark performance with other stores in a chain.
When subjected to further analysis, however, data from people counting solutions hold more value. For example, when this data is compared with figures from street counters, you can measure your store’s draw-in rate i.e., how many people walked by your store VS the number of people that entered.
When people counter data is combined with POS data, the store’s conversion rate can be calculated. Conversion rate tells you how much you maximised foot traffici.e.,how many store visitors ended up making a purchase.
If you just launched a marketing campaign, people counting technology-in combination with a reporting software -tells you how many new visitors the campaign attracted to your store. On further analysis, you can estimate how much $ was spent in attracting each customer and your marketing ROI.
How Heatmap Technology is Leveraged to Improve Store Layout
Heatmap technology plots the journey of every visitor through the store. When the data is analyzed, it shows an outline of how customers behave in your store. You see which sections see the most foot traffic, which products visitors engage with the most, and how visitors flow from section to section. Heatmap also shows customer dwell time in the store and how long visitors spent in different sections.

After analyzing heatmap data, a particular store noticed that a majority—70%—of their customers only visit 40% of the store. This affects how much sales they make and the store’s overall performance. To correct it, they implemented some strategies to drive foot traffic to the ignored sections. They placed adverts in the busy sections about promotional offers on products listed in the low-performing ones. They created cross-selling combinations that spanned the different zones.
The store also improved their layout to make the low-performing sections more accessible to visitors. These strategies were tested and improved until foot traffic distribution became even.
Additionally, some retail studies indicate that the longer customers spend in a store, the likelier they are to make a purchase. For example, heatmap data shows that the average dwell time in your store is 25 minutes and POS data shows that the average customer spends $40. If you implement strategies to increase customer dwell time, you increase the chances of a purchase and average customer spending.
Using Technology to Optimize Queue Management and Staffing
Primarily, the Queue Management System notifies the manager when queues are starting to form in the store. Historical data from this software can however be analyzed to identify breaks in the buying process. It shows how long customers spend on queues and the average checkout time. The Queue system also measures how many customers abandon their shopping because of extended wait-times.
Since queues and long lines are mostly caused by staffing shortages, data from the Queue Management System can be used to improve staffing. Over time, an optimal staff-to-customer ratio is maintained in your store; during busy as well as slow periods.
Making the most of foot traffic is how brick-and-mortar stores compete favorably with e-commerce giants. It is how your store competes against its physical competitors. Before you can maximize footfall, however, you first need to understand it. And to understand it, you need to measure and analyze it. The technologies above offer a good means to do this.
Sponsor Ads
Created on Sep 18th 2019 13:33. Viewed 498 times.

