How to Make a Gantt Chart in Google Sheets
Gantt Chart is a kind of spreadsheet bar chart that describes breakdown tasks, events, and schedules of the particular project or assignment. Google Sheet’s Gantt Chart provides various features for creating a spreadsheet chart of Google Docs.
It packs with management features and tools for making your project jobs and assignment easy by graphing, visualizing projects schedule.
There are many software programs for “Project Management” for handling assignments and projects, but these are not easy to illustrate your work more simply.
Here is how to make ‘Gantt charts” on “Google Sheets.” Follow these methods to create them:
- First and foremost, you have to create a compact table and then enter the appropriate title in the provided cells for getting started.
- Then, you have to provide particular regarding the project in appropriate cells and positions. It might be like Project type, beginning and a finishing date.
- Now, for computing the project’s graphs, you have to create a matching table on any portion of your existing chart.
- You have to provide proper details in each section of your Gantt.
Note: The Gantt table should include three different titles for Gantt: “Tasks,” “start date,” and the last one is “Task Duration.”
- After that, you should have to compute the time duration and the beginning day of the project. The heading “Tasks” should be in its proper position. You may reference, copy and rewrite the particular cell that you wish.
Note: In case you like to figure out “Start on Day,” then you are required to search the difference between two different tasks, including one of the first starting task. If you wish to do this, then you have to abide by these steps:
- Firstly, you have to turn each date into an un-fractioned number.
- Then you have to deduct the number from the first beginning date. It might look like:
“<TaskStart> – <FirstTaskStart>.”
Note: In the “firstTaskStart,” you have to provide an absolute evaluation.
Note: “Google Sheets” applies the dollar symbol “$” to fix a column or a row, but we will use both column and row for value referencing. For copying the similar rule/formula, we will apply the Dollar symbol.
- Now, tap the “Enter” key and hit the cell once more and double click on the small blue square.
- Then, you have to compute the time of the project. To do so, you have to mention how long the project’s task goes.
Note: It seems some tricky to search the difference between some multiple values. The formula will look like:
“<CurrentTaskEndDate> – <FirstTaskStartDate>” – “<CurrentTaskStartDate> – <FirstTaskStartDate>”
- After that, you have to tap the “Enter” key.
Note: You have to change each date format into an unfractionated number for referencing value. While applying “$” sign, then variables remained alike.
- Then hit the cell once more.
- Now, go to the compact blue coloured square and then double click.
- Now, you will see that your sheets will automatically fill the similar variables in the rest of the provided cells.
- Then select the whole table.
- Next, tap on the “Insert” button.
- Then, navigate to the “Charts” option.
- After that, go to the extreme right-hand side portion of your window and then look for the “Chart Editor” section there.
- Next, tap the pull drop box menu located under the “Chart Type” section.
- Then, scroll your page down and then hit the “Stacked Bar Chart.”
- At last, click on any of the available light red tabs. You can choose colors from the color panel, but you have to select the “None” option present at the uppermost portion of your color selector.
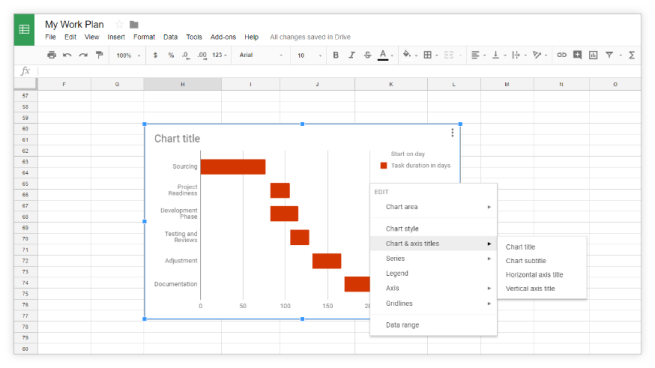
- After that, Navigate to “Customize” section located at the panel of “Chart Editor.”
- Then tap on “Chart and Axis Titles.”
- After that, provide a name for your chart.
Source : https://mcafeeactivate.website/how-to-make-a-gantt-chart-in-google-sheets/
Alex Smith is a creative person who has been writing blogs and articles about cyber security. He writes about the latest updates regarding mcafee.com/activate and how it can improve the work experience of users. His articles have been published in many popular e-magazines, blogs and websites.
Related Article

Post Your Ad Here
Comments