 Articles
Australia’s Wind Power Output is a Completely Joke
by Rudy P. SysAdmin at howtofindthemoneyIf you’re looking for a definition of ‘hopeless joke’, look no further than the daily contribution of Australia’s 6,960 MW industrial wind power fleet.
One hackneyed myth relied upon by the wind cult in this country (everywhere, really) is that the “wind is always blowing somewhere”. Which is complete and utter bollocks.
Spread from Far North Queensland, across the ranges of NSW, all over Victoria, Northern Tasmania and across South Australia its entire capacity routinely delivers just a trickle of its combined notional capacity.

Depicted above – courtesy of Aneroid Energy – is the output delivered by Australian wind power outfits to the Eastern Grid on 13 April.
Between Noon and 6pm output ranged between 110 and 170 MW, representing between 1.58% and 2.44% of the fleet’s combined notional capacity. That’s what we mean by “hopeless joke”.
Set out at the end of this post is the output, so far, for the month of April, which repeats the punchline, over and over again.
Collapses of over 3,000 MW or more that occur over the space of a couple of hours are routine, as are rapid surges of equal magnitude, which make the grid manager’s life a living hell, and provide the perfect set up for power market price gouging by the owners of conventional generators, who cash in on the chaos.
Instead of the Windy Hill Wind Farm powering hundreds of thousand homes with ‘free’ energy lovingly caressed from mother nature’s benevolence, the daily reality is that Australia’s electricity is being supplied by coal and gas. As to the latter, Rafe Champion takes a look at its contribution (a real contribution) to Australia’s electricity demand and the only available antidote to the chaos caused by Australia’s wind industry, every single day.
The choke point in pictures. Get ready to cook with gas!
This was the situation just after sunset last Monday 13 April. First SE Australia, with the wind contributing 1% of demand.

And in South Australia, the wind leader of the nation.
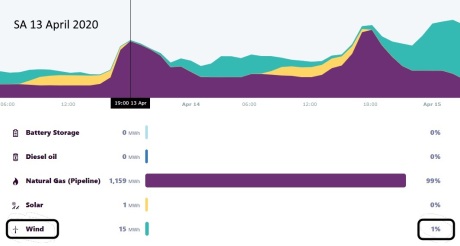
The same story with the wind contributing 1% and gas doing the heavy lifting. The chart reports on power generated in the state and so it does not show the coal power that comes from Victoria when there is not enough local power, which is a lot of the time.
At 10 this evening the windmills in SA were only turning at 7% of capacity and delivering 130MW – 9% of the demand in the state. 730MW came from Victoria, 50% of demand at the time.
Across the NEM at 10 the windmills were doing better, 28% of capacity – that is the long-term average, to provide 2GW (also 9% of demand at the time).

The 10 largest coal producers and exporters in Indonesia:
Source: Stop These Things
Sponsor Ads
Created on Apr 29th 2020 19:36. Viewed 568 times.

Comments
No comment, be the first to comment.
