 Articles
Machine Learning with PySpark Tutorial
by Tobi Marsh Tableau TrainerApache Spark comes with a library named MLlib to perform Machine Learning tasks using the Spark framework. Since there is a Python API for Apache Spark, i.e., PySpark, you can also use this Spark ML library in PySpark. MLlib contains many algorithms and Machine Learning utilities.
In this tutorial, you will learn how to use Machine Learning in PySpark. The dataset of Fortune 500 is used in this tutorial to implement this. This dataset consists of the information related to the top 5 companies ranked by Fortune 500 in the year 2017.
The dataset looks like below:
| Rank | Title | Website | Employees | Sector |
| 1 | Walmart | http://www.walmart.com | 2,300,000 | Retail |
| 2 | Berkshire Hathaway | http://www.berkshirehathaway.com | 367,700 | Finance |
| 3 | Apple | http://www.apple.com | 116,000 | Technology |
| 4 | ExxonMobil | http://www.exxonmobil.com | 72,700 | Energy |
| 5 | McKesson | http://www.mckesson.com | 68,000 | Wholesale |
In this Spark ML tutorial, you will implement Machine Learning to predict which one of the fields is the most important factor to predict the ranking of the above-mentioned companies in the coming years. Also, you will use DataFrames to implement Machine Learning.
What is PySpark MLlib?
Basic Introduction to PySpark MLlib
Spark MLlib is the short form of the Spark Machine Learning library. Machine Learning in PySpark is easy to use and scalable. It works on distributed systems. You can use Spark Machine Learning for data analysis. There are various techniques you can make use of with Machine Learning algorithms such as regression, classification, etc., all because of the PySpark MLlib.
Parameters in PySpark MLlib
Some of the main parameters of PySpark MLlib are listed below:
- Ratings: This parameter is used to create an RDD of ratings, rows, or tuples.
- Rank: It shows the number of features computed and ranks them.
- Lambda: Lambda is a regularization parameter.
- Blocks: Blocks are used to parallel the number of computations. The default value for this is −1.
Performing Linear Regression on a Real-world Dataset
Let’s understand Machine Learning better by implementing a full-fledged code to perform linear regression on the dataset of the top 5 Fortune 500 companies in the year 2017.
Go through these Machine Learning Interview Questions and Answers to excel in your ML interview!
Loading Data
As mentioned above, you are going to use a DataFrame that is created directly from a CSV file. The following are the commands to load data into a DataFrame and to view the loaded data.
- Input:
- In [1]:
from pyspark import SparkConf, SparkContext
from pyspark.sql import SQLContext
Sc = SparkContext()
sqlContext = SQLContext(sc)
-
- In [2]:
company_df = sqlContext.read.format('com.databricks.spark.csv').options(header='true', inferschema='true').load('C:/Users/intellipaat/Downloads/spark-2.3.2-bin-hadoop2.7/Fortune5002017.csv')
company_df.take(1)
You can choose the number of rows you want to view while displaying the data of the DataFrame. Here, only the first row is displayed.
- Output:
- Out[2]:
[Row (Rank=1, Title= ‘Walmart’, Website= ‘http:/www.walmart.com’, Employees-2300000, Sector= ‘retailing’)]
Data Exploration
To check the data type of every column of a DataFrame and to print the schema of the DataFrame in a tree format, you can use the following commands, respectively:
- Input:
- In[3]:
company_df.cache()
company_df.printSchema()
- Output:
- Out [3]:
DataFrame[Rank: int, Title: string, Website: string, Employees: Int, Sector: string]
root
|-- Rank:  integer (nullable = true)
|-- Title:  string (nullable = true)
|-- Website:  string (nullable = true)
|-- Employees:  integer (nullable = true)
|-- Sector:  string (nullable = true)
Become an ML Specialist by going for this best ML Courses in Delhi!
Performing Descriptive Analysis
- Input:
- In [4]:
company_df.describe().toPandas().transpose()
- Output:
- Out [4]:
| 0 | 1 | 2 | 3 | 4 | |
| Summary | count | mean | stddev | min | max |
| Rank | 5 | 3.0 | 1.581138830084 | 1 | 5 |
| Title | 5 | None | None | Apple | Walmart |
| Website | 5 | None | None | www.apple.com | www.walmart.com |
| Employees | 5 | 584880.0 | 966714.2168190142 | 68000 | 2300000 |
| Sector | 5 | None | None | Energy | Wholesalers |
Finding the Correlation Between Independent Variables
To find out if any of the variables, i.e., fields have correlations or dependencies, you can plot a scatter matrix. Plotting a scatter matrix is one of the best ways in Machine Learning to identify linear correlations if any.
You can plot a scatter matrix on your DataFrame using the following code:
- Input:
- In [5]:
import pandas as pdnumeric_features = [t[0] for t in company_df.dtypes if t[1] == 'int' or t[1] == 'double']
sampled_data = company_df.select(numeric_features).sample(False, 0.8).toPandas()
axs = pd.scatter_matrix(sampled_data, figsize=(10, 10))
n = len(sampled_data.columns)
for i in range(n):
v = axs[i, 0]
v.yaxis.label.set_rotation(0)
v.yaxis.label.set_ha('right')
v.set_yticks(())
h = axs[n-1, i]
h.xaxis.label.set_rotation(90)
h.set_xticks(())
- Output:
- Out [5]:
![Out[5]](https://intellipaat.com/mediaFiles/2018/12/Out5.png)
Here, you can come to the conclusion that in the dataset, the “Rank” and “Employees” columns have a correlation. Let’s dig a little deeper into finding the correlation specifically between these two columns.
Correlation Between Independent Variables
- Input:
- In [6]:
import six
for i in comapny_df.columns:
if not( isinstance(company_df.select(i).take(1)[0][0], six.string_types)):
print( "Correlation to Employees for ", i, company_df.stat.corr('Employees',i))
- Output:
- Out [6]:
Correlation to Employees for Rank   −0.778372714650932
Correlation to Employees  1.0
The value of correlation ranges from −1 to 1, the closer it is to ‘1’ the more positive correlation can be found between the fields. If the value is closer to −1, it means that there is a strong negative correlation between the fields. Now, you can analyze your output and see if there is a correlation or not, and if there is, then if it is a strong positive or negative correlation.
Preparing Data
- Input:
- In [7]:
from pyspark.ml.feature import VectorAssembler
vectorAssembler = VectorAssembler(inputCols = ['Rank', 'Employees'], outputCol = 'features')
tcompany_df = vectorAssembler.transform(company_df)
tcompany_df = tcompany_df.select(['features', 'Employees'])
tcompany_df.show(3)
- Output:
- Out [7]:
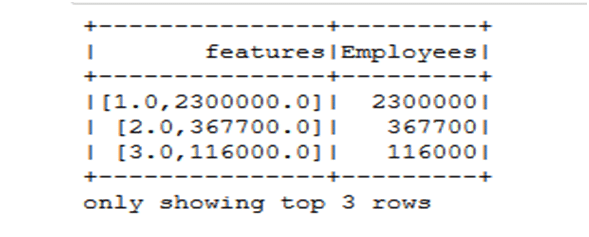
- Out [7]:
- Input:
- In [8]:
splits = tcompany_df.randomSplit([0.7, 0.3])
train_df = splits[0]
test_df = splits[1]
Linear Regression
- Input:
- In [10]:
from pyspark.ml.regression import LinearRegression
lr = LinearRegression(featuresCol = 'features', labelCol='Emplyees', maxIter=10, regParam=0.3, elasticNetParam=0.8)
lr_model = lr.fit(train_df)
print("Coefficients: " + str(lr_model.coefficients))
print("Intercept: " + str(lr_model.intercept))
- Output:
- Out [10]:
Coefficients: [-32251.88812374517, 0.9255193858709874]
Intercept: 140317.88600801243
After performing linear regression on the dataset, you can finally come to the conclusion that ‘Employees’ is the most important field or factor, in the given dataset, which can be used to predict the ranking of the companies in the coming future. ‘Ranks’ has a linear correlation with ‘Employees,’ indicating that the number of employees in a particular year, in the companies in our dataset, has a direct impact on the Rank of those companies.
Know more from Machine Learning with Spark Tutorial.
Sponsor Ads
Created on Nov 3rd 2020 05:11. Viewed 316 times.

